Infrastructure Resilience
Adapting High Aswan Dam Operation to Challenges of the Grand Ethiopian Renaissance Dam
The resilience of HAD operation to GERD construction typifies one of the challenges facing dam operators and water managers in downstream Nile riparian countries.
Recently, various studies have investigated the impacts of GERD on downstream countries with more focus on the GERD filling strategies.
However, crucial insights on how dam operators can adapt to potential impacts have not been capitalized in previous studies.
Our study proposes a physical blueprint that employs water scarcity indices to infer modified reservoir operation
that could adapt to streamflow alterations while maintaining the supply to downstream water use, i.e., water supply for irrigation and hydropower demands.
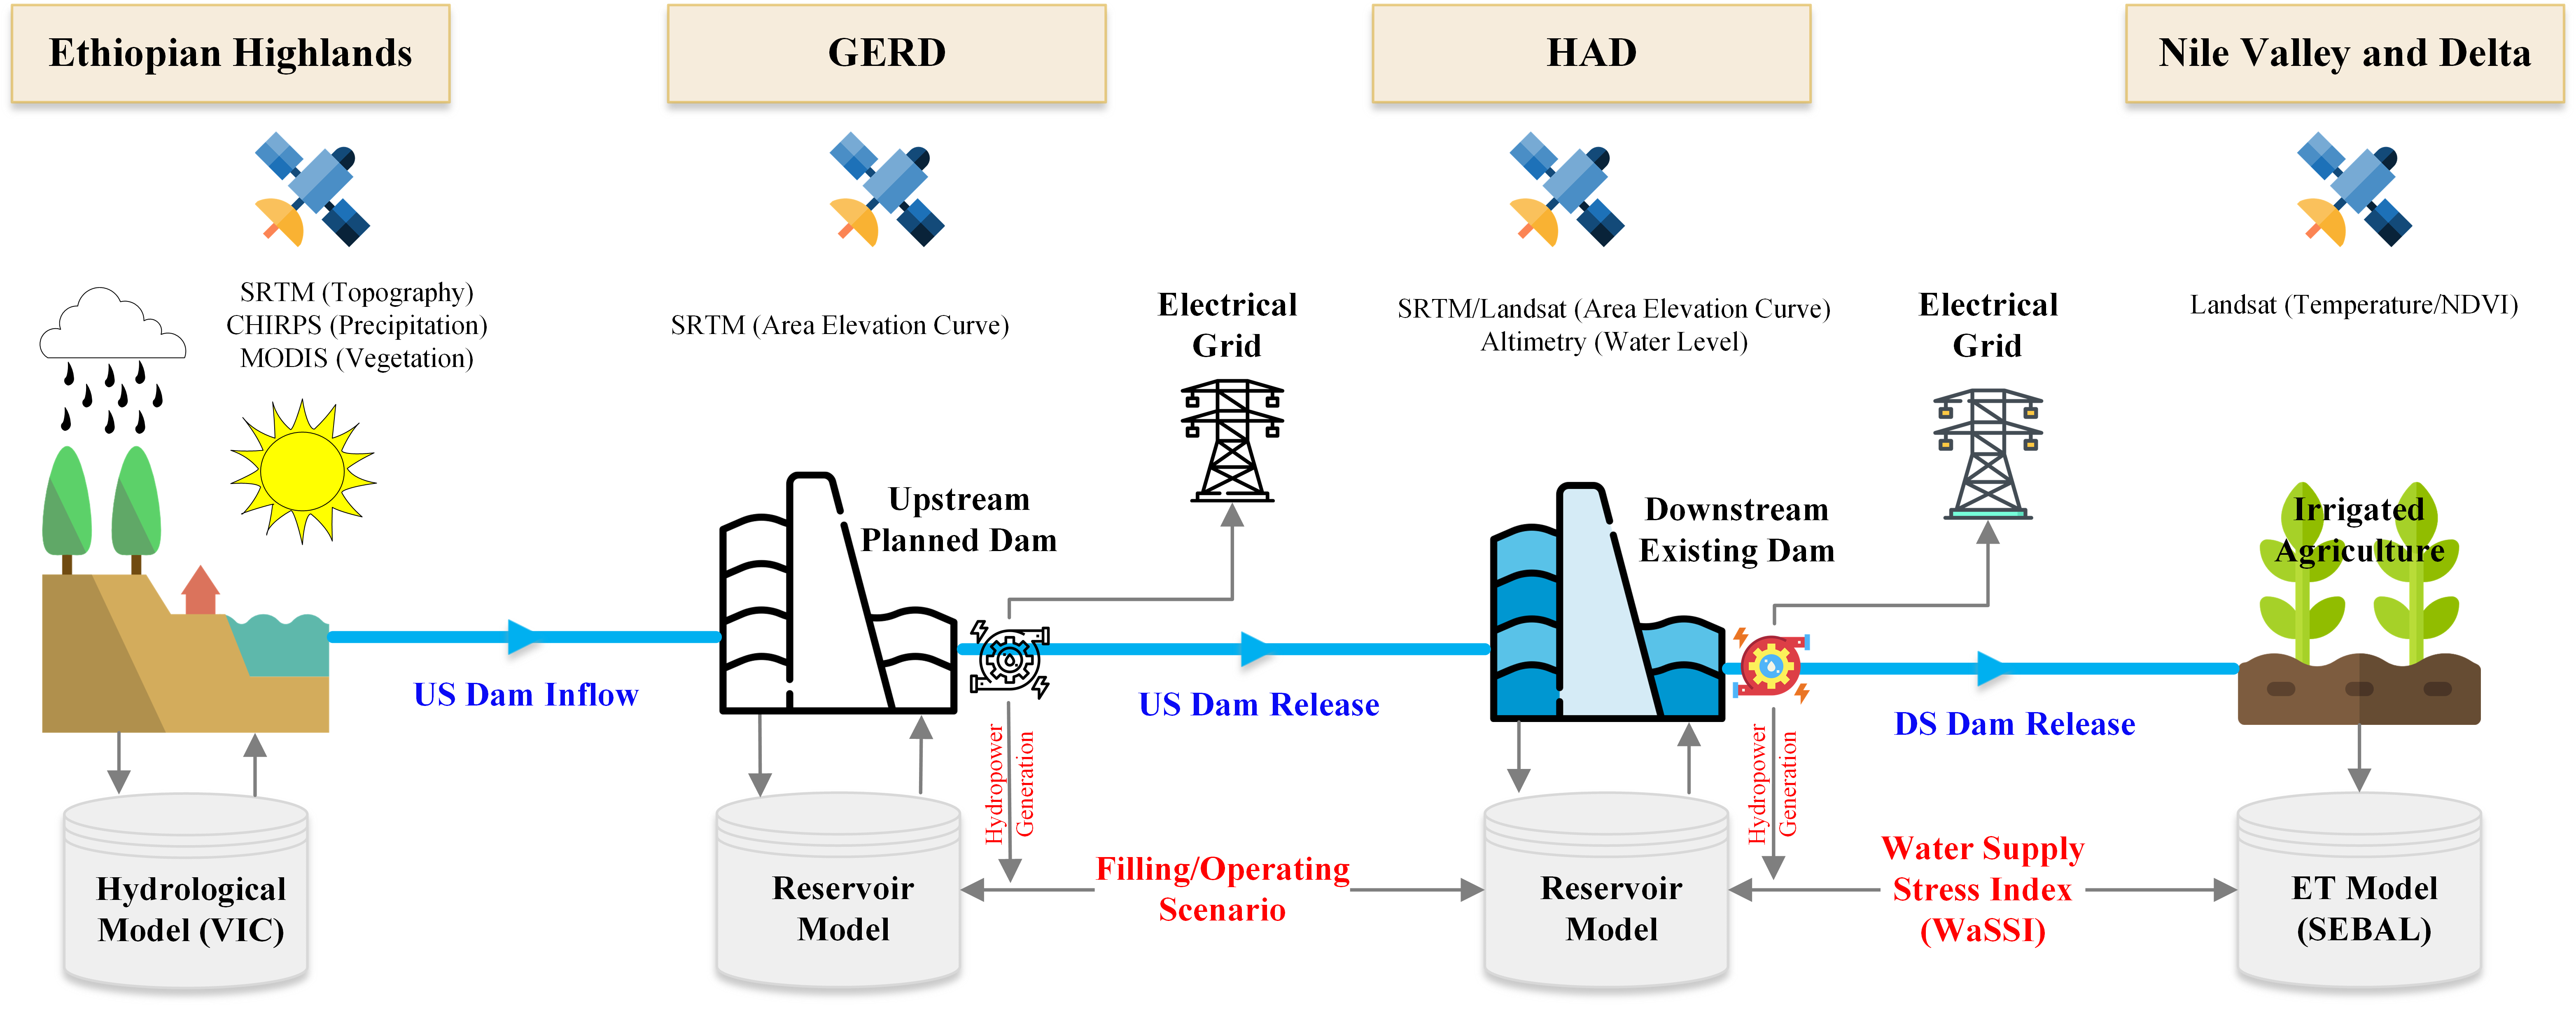
Schematic diagram of the blueprint proposed to re-evaluate the operation of existing dam under the filling/operation of an upstream planned dam.
Highlights
• High Aswan Dam can adapt its operation in summer months by elevating the downstream stress level (store more and release less),
to mitigate the effects of rapid GERD filling.
• A 7-year filling scenario by Ethiopia is minimally disruptive to operations of High Aswan Dam and results in faster recovery.
Scientific Focus Area (SFA): Integrated Modeling - Remote Sensing - Infrastructure Resilience - Hydrosystems Dynamics
Reference:
Eldardiry, H., & Hossain, F. (2020). A Blueprint for Adapting High Aswan Dam Operation in Egypt to Challenges of Filling
and Operation of the Grand Ethiopian Renaissance Dam. Journal of Hydrology (DOI: https://doi.org/10.1016/j.jhydrol.2020.125708).
The Value of Long-term Streamflow Forecasts in Adaptive Reservoir Operation
Our study evaluates the use of long-term climate forecasts
to improve real-time operations of High Aswan Dam (HAD) in the Nile river basin.
A suite of eight models from North American Multimodel Ensemble (NMME) are used to generate monthly precipitation
and temperature forecasts at up to 12 months of lead time. The NMME forcing are used to drive the Variable Infiltration Capacity (VIC) model
and produce monthly streamflow forecasts for an optimization horizon of four years from 1998 to 2001.
The value of NMME-based forecasts to reservoir operations are compared with perfect and climatology-based forecasts.

Forecast-based Adaptive Reservoir Operation (FARO) framework for deriving adaptive reservoir operating policy using streamflow forecasts
Highlights
• The forecast horizon for HAD operation ranges between 8- and 11-month lead time at low and high demand scenarios, respectively, beyond which the forecast information no longer improves the release decision.
• Actual forecasts from NMME models can significantly improve the HAD operation with an average gain in forecast value of 77%
compared to the climatology-based forecasts.
• When considering the operation of upstream Grand Ethiopian Renaissance Dam (GERD), using streamflow forecasts minimally helps to maintain current target objectives of HAD operation and therefore result in higher operation costs as opposed to current conditions without GERD.
Scientific Focus Area (SFA): Hydrosystems Modeling - Infrastructure Resilience
Reference: Eldardiry, H., & Hossain, F. (2021). The Value of Long-term Streamflow Forecasts in Adaptive Reservoir Operation: The Case of High Aswan Dam in the Transboundary Nile River Basin. Journal of Hydrometeorology.
Small-Scale Catchment Analysis of Water Stress in Wet Regions of the U.S.
Using the state of Louisiana as an example, this study quantifies the stresses on water resources and investigates the potential for opportunities to use surface water in lieu of groundwater pumping. The assessment is based on a fine watershed scale (12-digit Hydrological Unit Code [HUC] boundaries) water balance between the availability of surface and groundwater and surface water and groundwater demand. Water demand includes environmental flows, as well as public supply, rural domestic, industrial, power generation, agricultural, and aquaculture sectors. The seasonality of water stress is also addressed by incorporating monthly variations in surface water supply and irrigation demands.
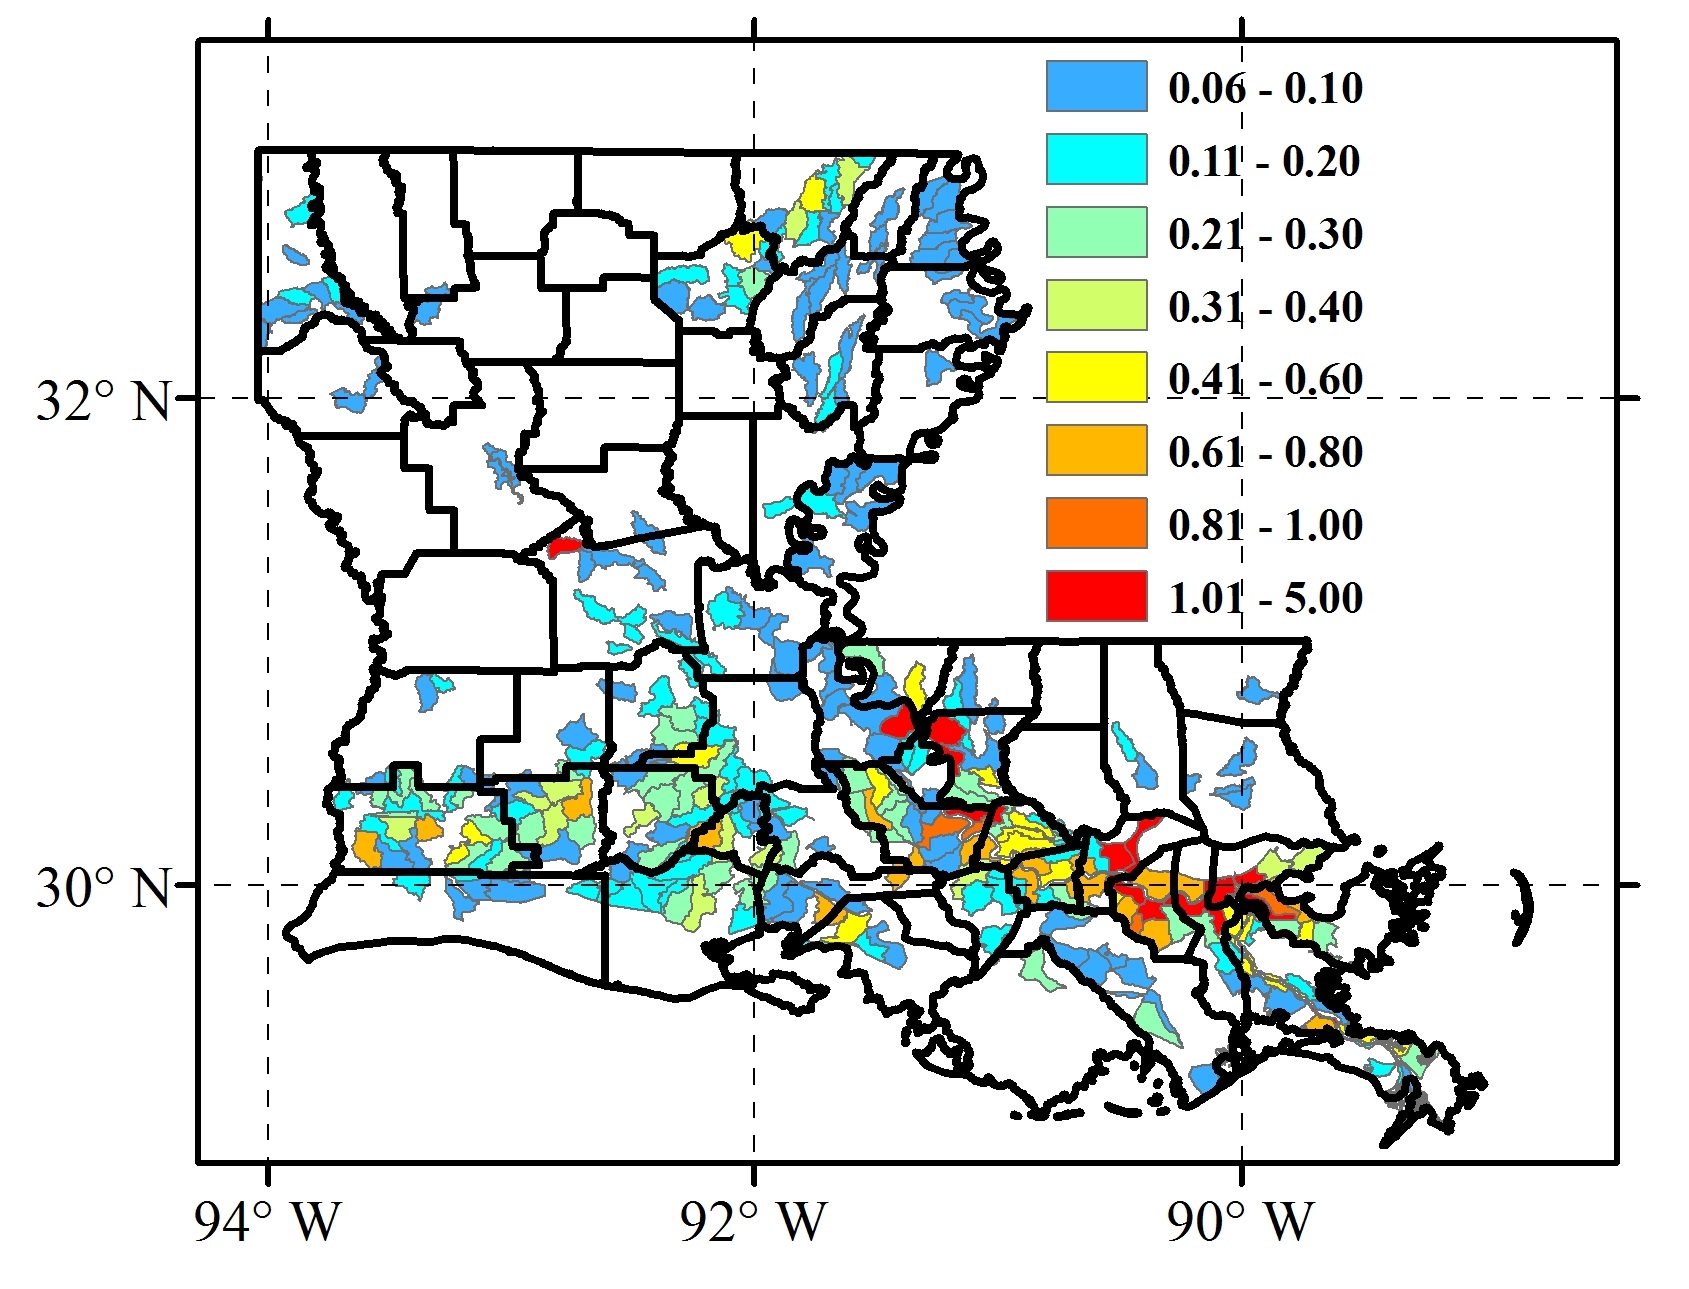
Water Supply Stress Index (WaSSI) on the HUC12 scale derived using annual average estimates of water supply and demand and a 50% environmental flow requirement (HUC12 watersheds with WaSSI less than 0.06 are displayed in white).
Highlights
• The areas of the highest water stress in Louisiana are largely attributable to water consumption for power generating plants or irrigation.
• The stress analysis reveals a significant over-drafting/deficit of groundwater in many of the states aquifer systems.
• Seasonal fluctuations in surface water supply and water withdrawals for irrigation highlight the fact
that the water system is under more stress during the summer season.
Scientific Focus Area (SFA): Hydrosystems Modeling - Hydrosystems Dynamics - Infrastructure Resilience
Reference:
Eldardiry, H., Habib, E., & Borrok, D. M. (2016). Small-scale catchment analysis of water stress in wet regions of the US: an example from Louisiana.
Environmental Research Letters, 11(12), 124031.
(DOI: https://doi.org/10.1088/1748-9326/aa51dc).
Energy-Water Nexus over the CONUS
The interactions between food production, energy production, and water supplies, sometimes referred to as the food-energy-water (FEW) nexus, are critically important to sustaining society. Two components of this nexus, energy and water, are strongly interrelated: Generating electricity and refining fuel require us to use water; pumping, delivering, and treating water require us to use energy. Links between the energy and water systems are expected to intensify in the future. Therefore, it is important to understand and foster continued attention to the interdependency between the systems in the water-energy nexus.
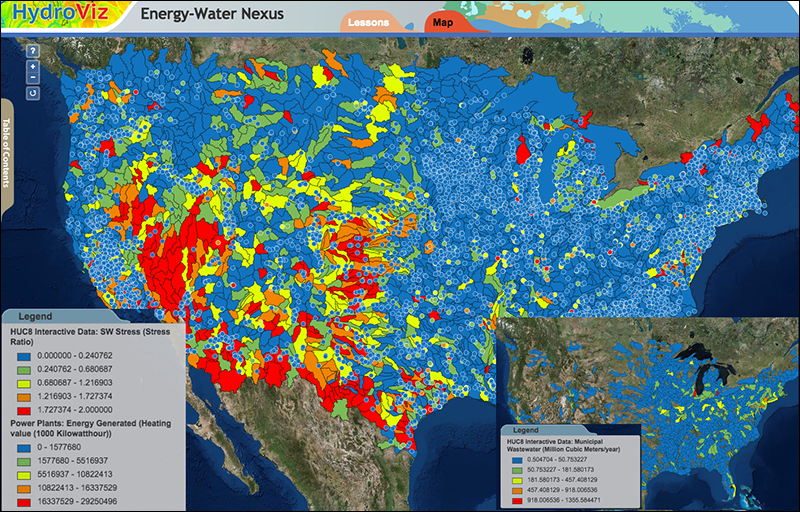
Using the energy-water nexus (HydroViz platform) to estimate net availability of water-for-energy resources and stresses on the water system (main panel) under different future scenarios of population growth, plant retrofitting options, and potential use of non-potable water resources (small inset).
Highlights
• Increase in energy demand may infringe on water availability for other sectors, and it is important to explore if non-potable water resources can alleviate such infringement.
• Changing the plant cooling system (e.g., re-circulating, versus once-through), fuel type (e.g., coal, natural gas),
or limiting greenhouse gas emission (e.g., via a carbon capture and sequestration, CCS) are primary factors to consider when assessing stresses on water system.
Scientific Focus Area (SFA): Integrated Modeling - Hydrosystems Dynamics - Infrastructure Resilience - Water Energy Nexus
Reference:
Habib, E., Eldardiry, H., and Tidwell, V. (2017). New online tool teaches students about the energy-water nexus, Eos, 98.
(DOI: https://doi.org/10.1029/2017EO084487).
Carbon Capture and Sequestration in Power Generation: Impacts and Opportunities for Water Sustainability
Water is an integral element of Carbon Capture and Sequestration (CCS) processes. Since water is used for cooling and emissions scrubbing,
deployment of CCS will potentially increase water withdrawals to meet the added needs for chemical and physical processes of capturing and
separating large volumes of CO2. Thus, the CCS technologies are expected to significantly introduce
additional stresses on the sustainability of water system.
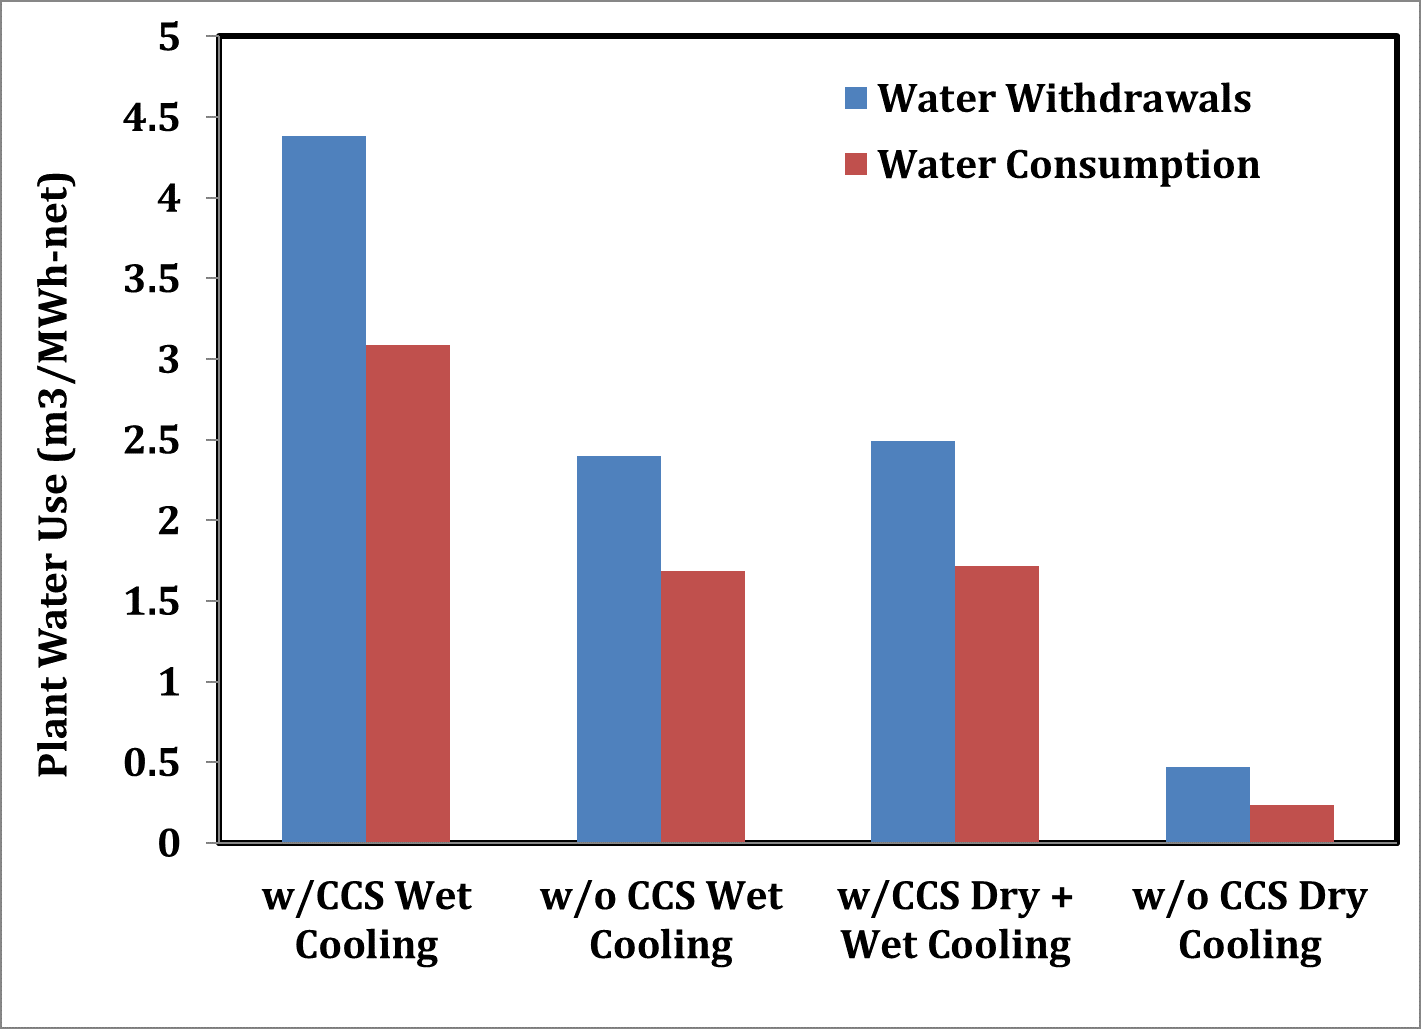
Effects of primary cooling technology on plant water use at coal power plants with and without carbon capture and sequestration (CCS).
Highlights
• CCS-equipped power plants have shown significant increases in water consumption in the range of 45 to 90 percent.
• The need for integrating the environmental, economic, and societal aspects of CCS deployment into future assessment of the viability of CCS operations.
• The extracted brine can potentially be used as a freshwater source to alleviate stresses in areas with water supply shortages.
Scientific Focus Area (SFA): Water Energy Nexus - Infrastructure Resilience
Reference:
Eldardiry, H., & Habib, E. (2018). Carbon capture and sequestration in power generation: review of impacts and opportunities for water sustainability.
Energy, Sustainability and Society, 8(1), 1-15
(DOI: https://doi.org/10.1186/s13705-018-0146-3).
Atmospheric River-Induced Precipitation and Snowpack during the Western United States Cold Season
In this study, we characterized precipitation and snow water equivalent associated with ARs intersecting the US western coast during the cold season (November through March)
of water years 1949-2015. For each AR landfalling date, we retrieved the precipitation and relevant hydrometeorological variables
from dynamically downscaled atmospheric reanalyses (NCEP/NCAR) using the WRF mesoscale numerical weather prediction model.
Landfalling ARs resulted in higher precipitation amounts throughout the domain than did non-AR storms.
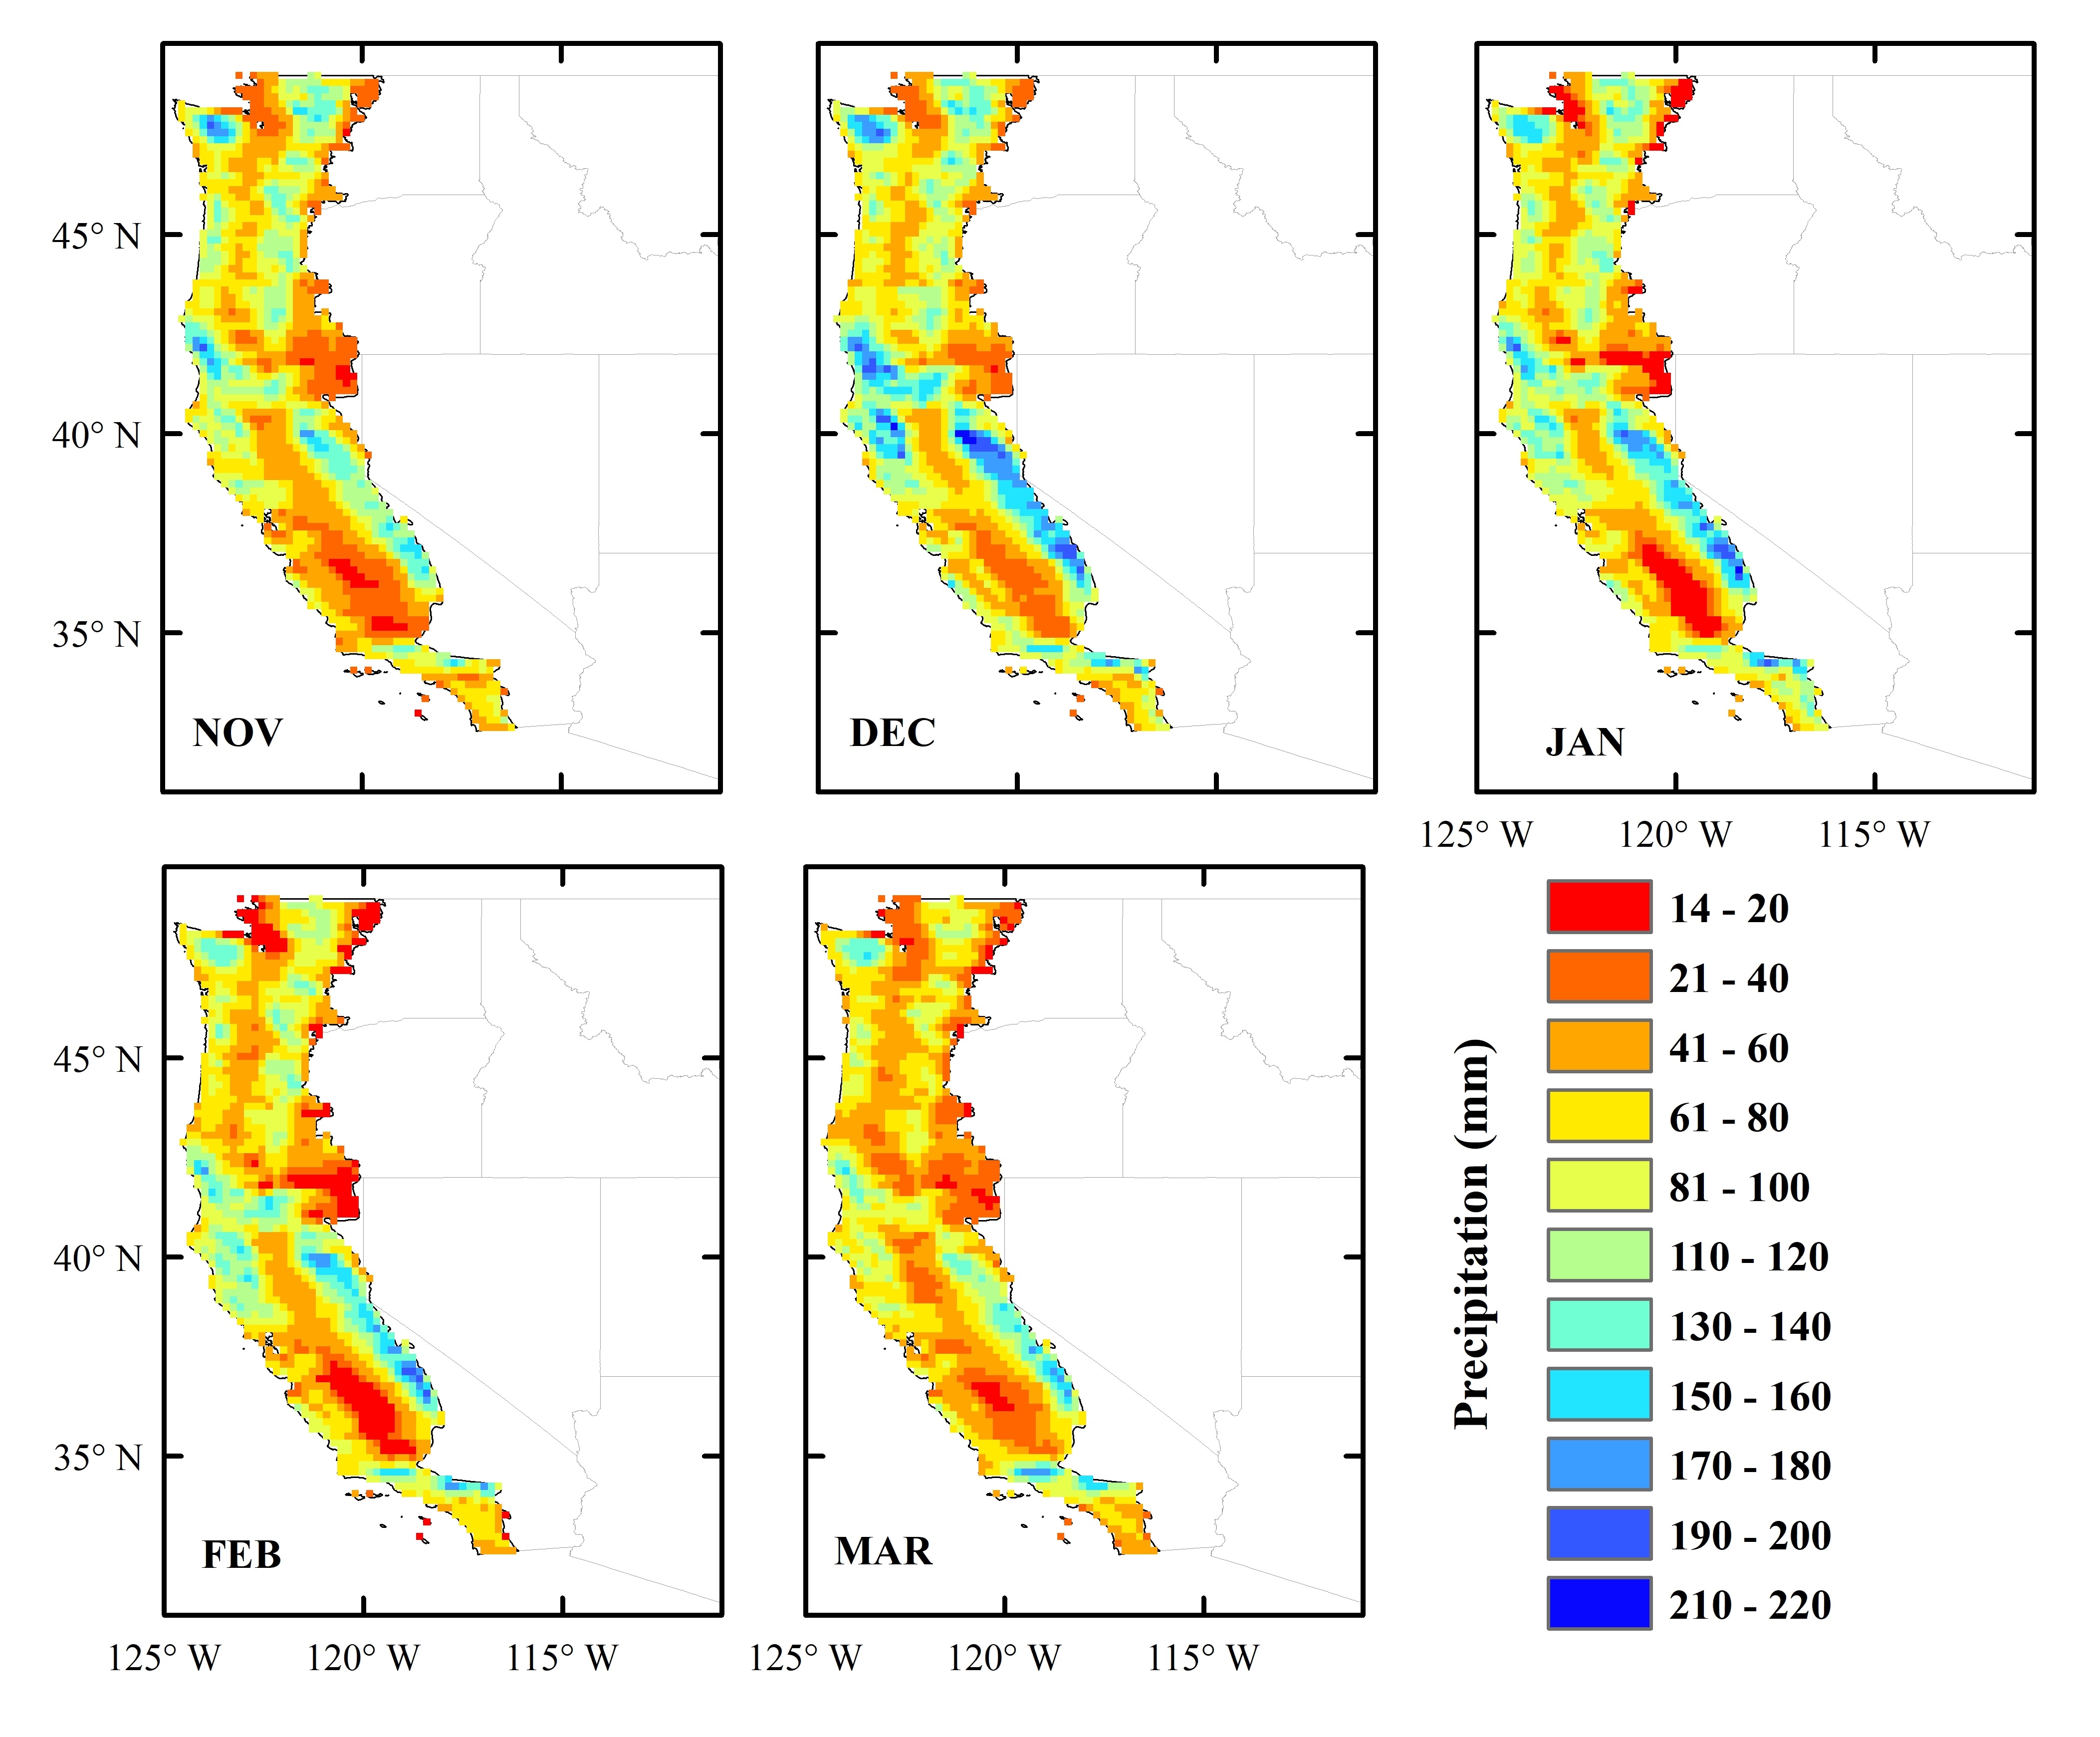
The average of upper 10th percentile daily precipitation over the western coastal domain during the winter (November to March) ARs for water years 1949-2015.
Highlights
• ARs contributed the most extreme precipitation events during January and February.
• Daily snow water equivalent (SWE) changes during ARs indicate that high positive net snow accumulation conditions accompany ARs in December, January, and February.
• Analysis of ARs during dry and wet years reveals that ARs during wet years are more frequent, and produce heavier precipitation and snow accumulation as compared with dry years.
Scientific Focus Area (SFA): Extreme Events - Infrastructure Resilience
Reference: Eldardiry, H., Mahmood, A., Chen, X., Hossain, F., Nijssen, B., & Lettenmaier, D. P. (2019). Atmospheric River–Induced Precipitation and Snowpack during the Western United States Cold Season. Journal of Hydrometeorology, 20(4), 613-630 (DOI: https://doi.org/10.1175/JHM-D-18-0228.1).